Quantitative finance · Portfolio risk
QuantumX AEGIS.
An interactive platform for comparing ETF portfolios, stress-testing losses, and deciding whether an allocation meets its risk limits.
- Status
- Interactive research application
- Context
- Team QuantumX · Simulated USD 10 million endowment
- Technology
- Python · Streamlit · NumPy · pandas · SciPy · Plotly · SQLite
Problem
An investment committee needs to see whether a proposed allocation meets its risk limits, including when historical returns appear strong.
Solution
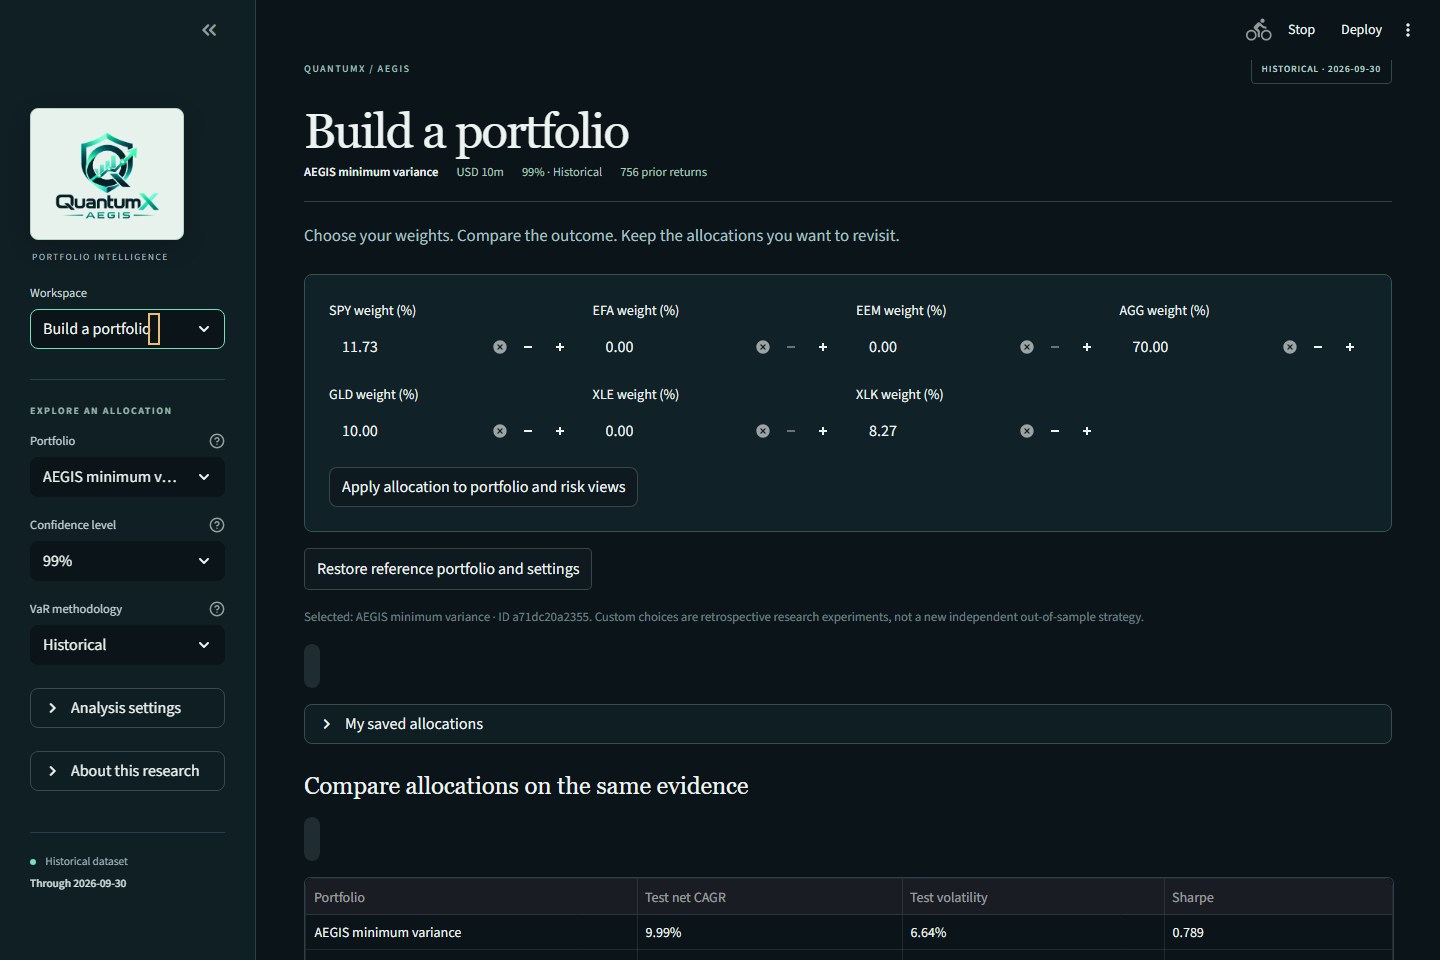
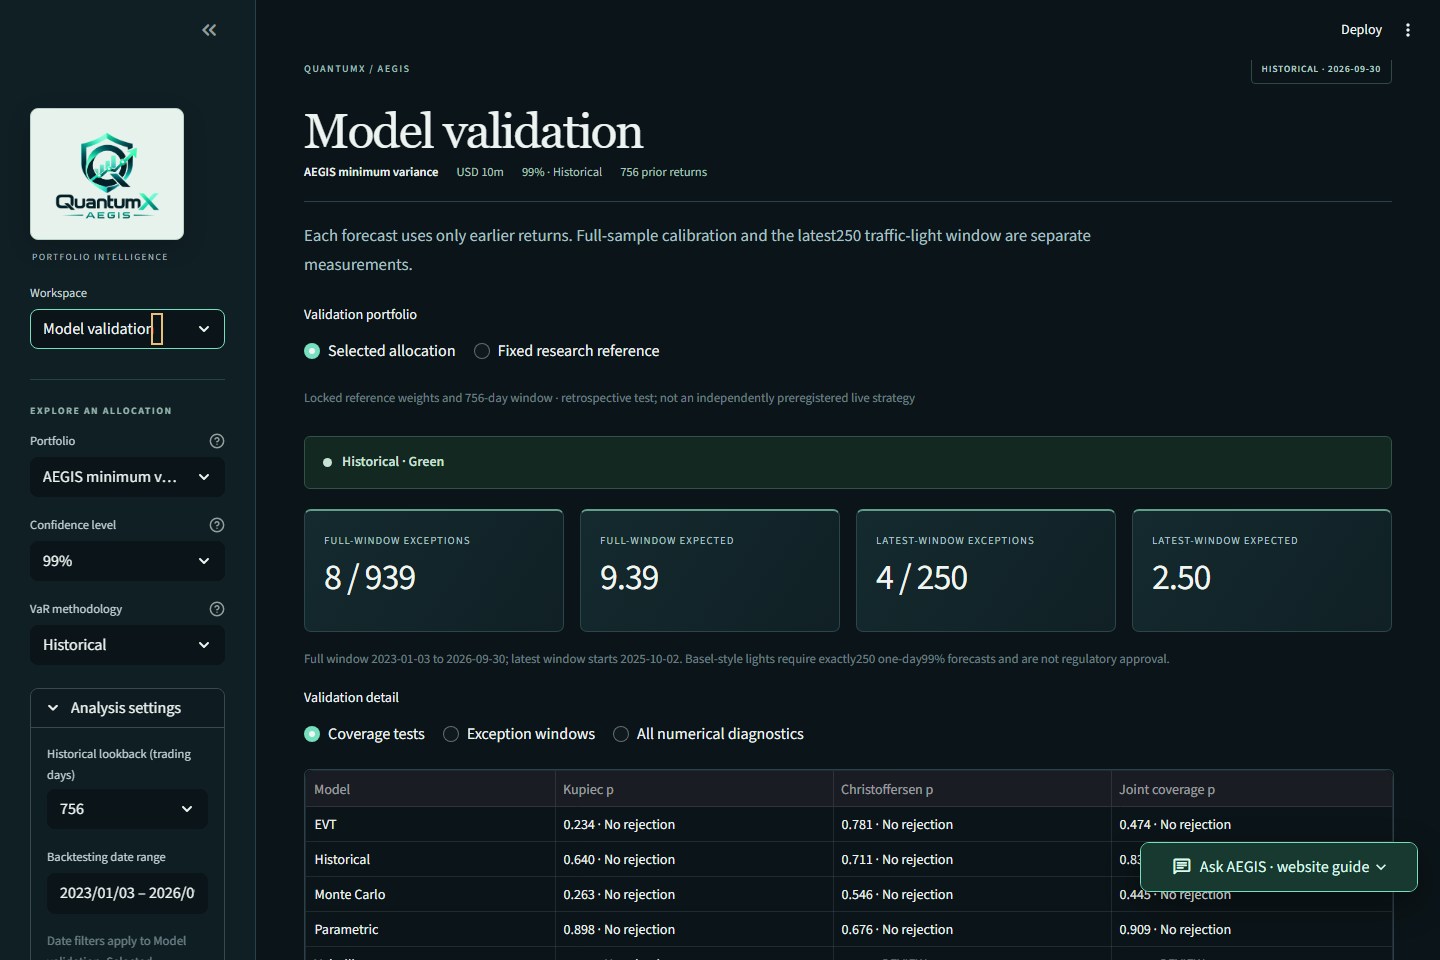
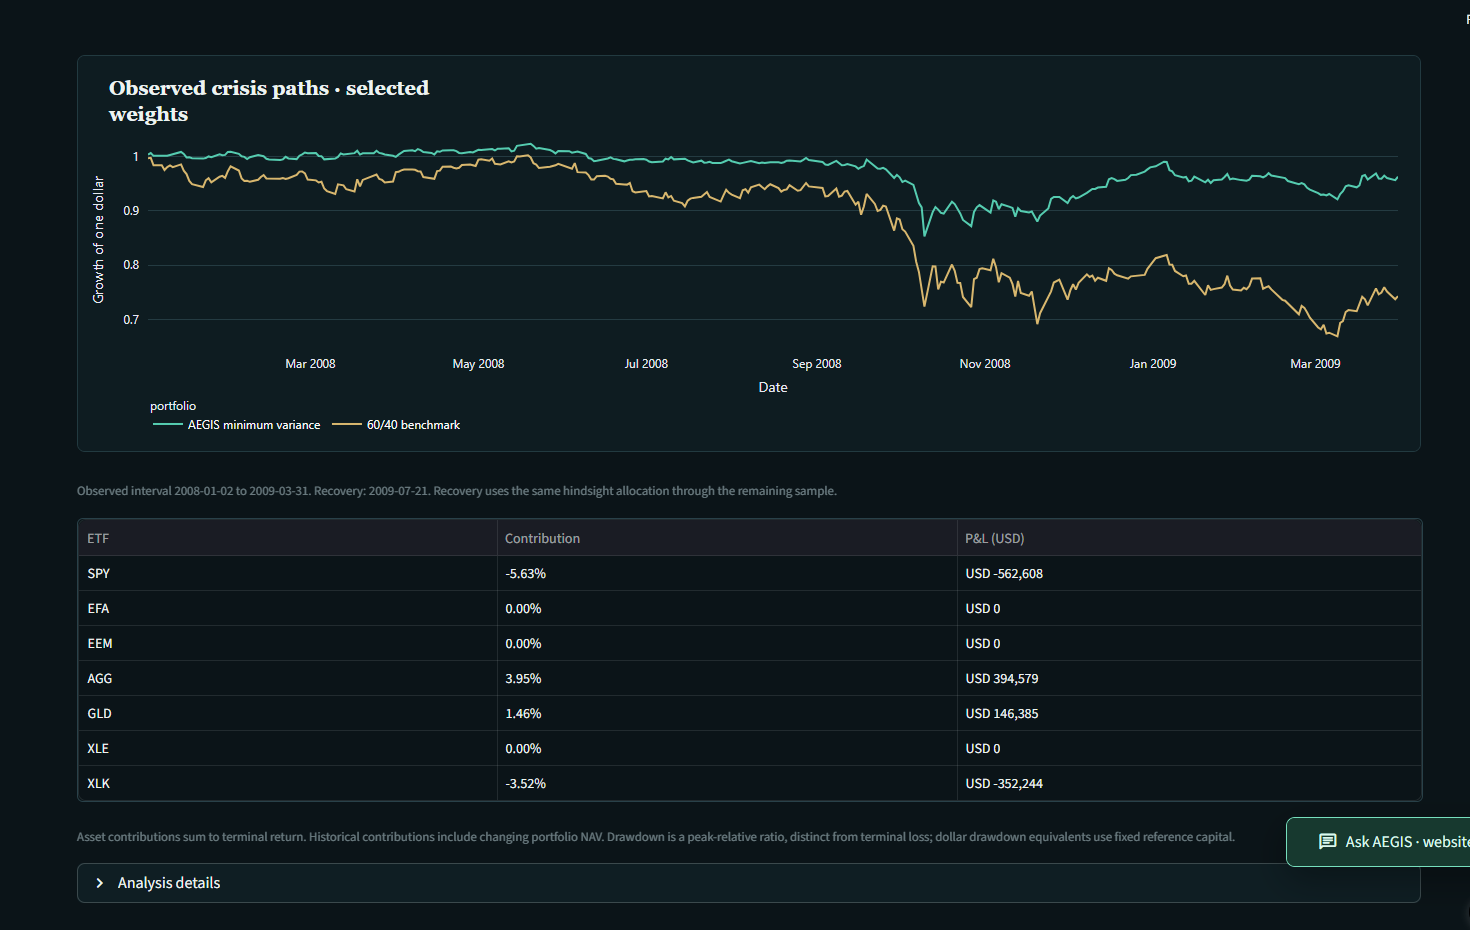
AEGIS lets users compare candidate allocations or enter custom weights across SPY, EFA, EEM, AGG, GLD, XLE, and XLK. It combines one-day risk forecasts, rolling validation, historical crisis replays, and custom equity, rate, and gold shocks. The dashboard identifies policy breaches and exports portfolio-specific PDF and CSV reports.
Architecture
- 01Frozen ETF data
- 02Train and compare allocations
- 03Estimate and backtest risk
- 04Check limits and export
My contribution
- Co-developed AEGIS with Sandun Wickramanayake, Samadhi Gamagedara, Kawmini Attygalle, and Kasun Dissanayake.
- Worked with the team on portfolio construction, the Streamlit risk views, and the research workflow that connects validation and stress tests to a funding recommendation.
Engineering challenge
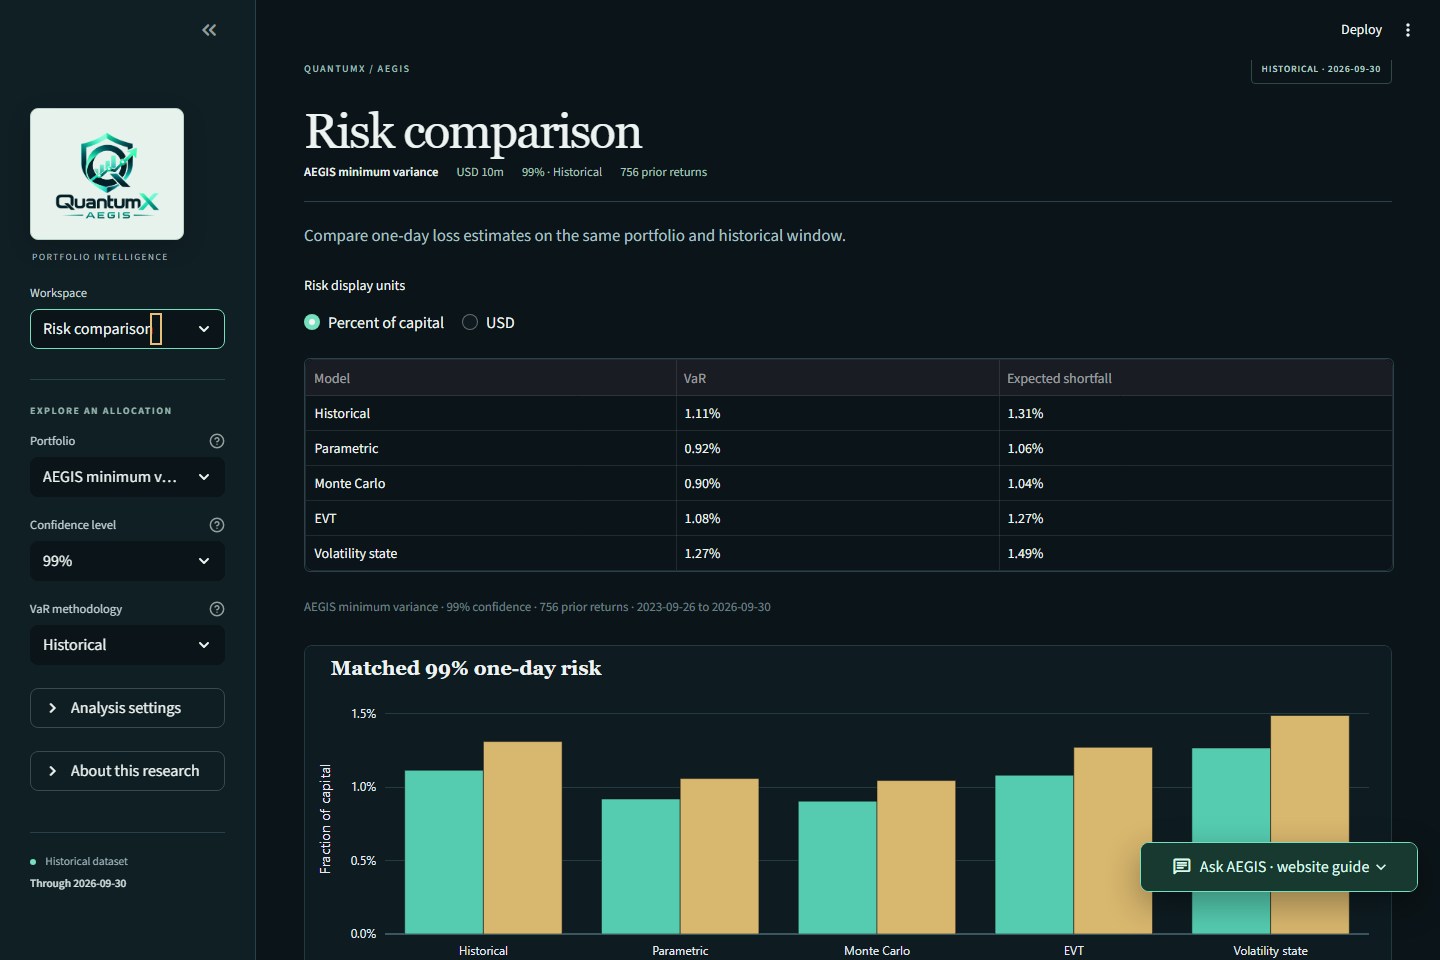
A one-day loss forecast and a drawdown during a market crisis answer different questions. AEGIS compares historical, parametric, Monte Carlo, extreme-value, and volatility-state estimates on a common footing, then reports crisis losses and policy checks separately.
App screenshots
Results & demo
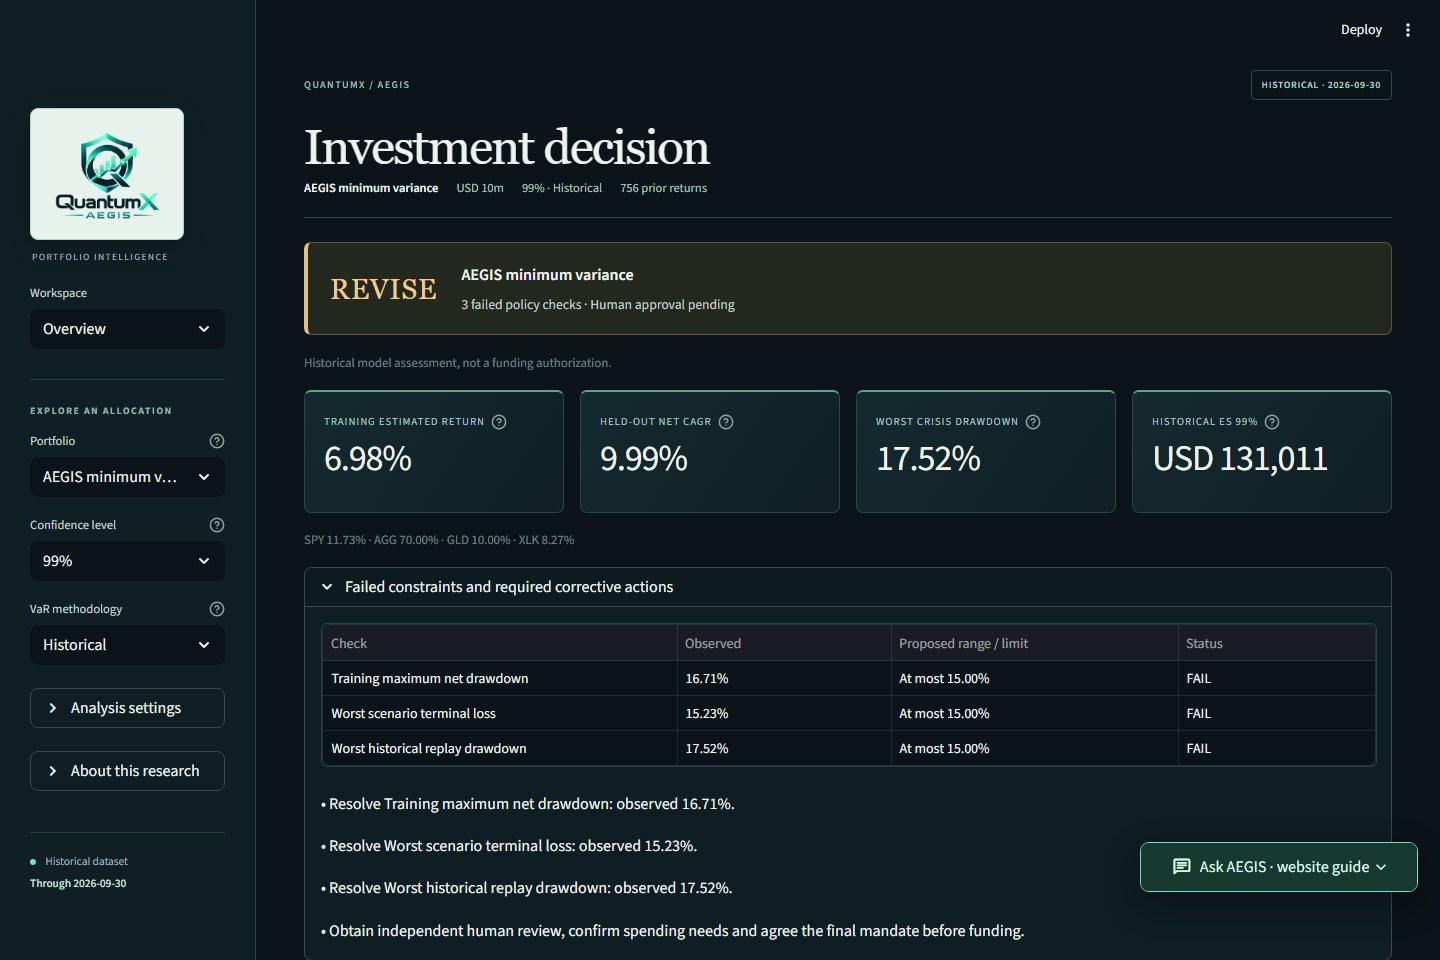
The reference minimum-variance portfolio returned 9.99% annualized after modeled costs in the held-out historical test. Three loss measures exceeded their proposed 15% limits, so AEGIS recommended revising the allocation before funding.
Open the Streamlit app (opens in a new tab)What I’d improve
Validate a revised allocation on fresh data and incorporate spending needs, liabilities, and more detailed trading costs.
The portfolio and its funding decision are simulated. The research uses frozen historical data, and human approval remains independent of the model results.